개요
기존에 엑셀 다운로드 기능을 Apache POI 라이브러리를 통해 구현했는데 메모리도 많이 먹는 것 같고 non streaming 방식이라 streaming 방식인 fastexcel 라이브러리로 변경하려고 합니다.
기존 코드를 대체하기 위해서는 합리적인 이유가 필요한데 이를 위해 모니터링 툴을 연동하여 각각의 라이브러리를 적용했을 때 CPU 사용량, JVM Heap 메모리, 그리고 실행 속도를 비교해봤습니다.
처음에는 Spring Admin UI를 사용하려고 했지만 실무에서 Prometheous와 Grafana가 많이 쓰인다고 해서 프로메테우스와 그라파나를 연동해봤고 연동하는 방법에 대해 간단히 정리하고자 합니다.
다행히 잘 정리된 글들이 있어 해당 글들을 참고했습니다.
Spring Boot + Prometheus + Grafana를 이용한 모니터링(1/3)
프로젝트 중 모니터링 시스템을 구현해보려고 한다. Prometheus + Grafana를 이용해 Spring Boot 애플리케이션을 모니터링 해 볼 것이다. 모니터링 시스템은 너무많은 종류가 있어서 본인이 사용하고 싶
devbksheen.tistory.com
https://covenant.tistory.com/244
프로메테우스, 그라파나를 이용한 스프링부트 모니터링
Cover Photo by Tobias Tullius on Unsplash 0. 소개 스프링부트 웹 애플리케이션을 배포하여 경우 잘 동작하는지 모니터링을 통하여 애플리케이션의 상태를 확인해야합니다. 모니터링을 통하여 문제가 발
covenant.tistory.com
* fastexcel 라이브러리 관련해서는 추후 정리해보겠습니다.
1. 용어 정리
1.1 Metric
Metric은 어떤 어플리케이션을 쓰느냐에 따라 그리고 어떤 서비스를 사용하느냐에 따라 해석이 조금 달라질 수 있는 개념입니다.
보편적으로 매트릭이란 우리가 대시보드를 볼 때 특정 수치라고 생각하면 될 것 같고 예를 들자면 CPU 사용량, JVM Heap Memory 사용량 등이 있습니다.
1.2 Spring Actuator
Spring Actuator는 SpringBoot의 서브 프로젝트로 스프링부트 애플리케이션이 제공하는 여러 가지 정보를 쉽게 모니터링할 수 있게 지원하는 라이브러리입니다.
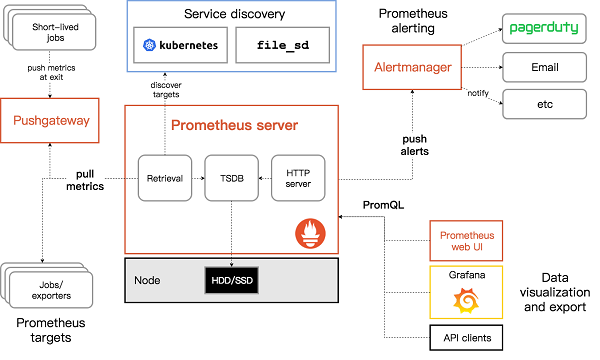
1.3 Prometheus
프로메테우스는 SoundCloud에서 만든 오픈소스 시스템 모니터링 및 경고 툴킷입니다.
많은 회사에서 모니터링 툴로 프로메테우스를 도입했으며 쿠버네티스에서도 프로메테우스를 사용하여 매트릭 수집 및 대시보드 구축하는 것을 장려하고 있습니다.
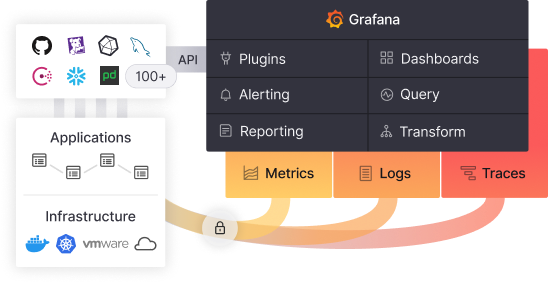
1.4 Grafana
그라파나는 매트릭을 시각화해주는 오픈소스 도구입니다.
저희가 이번에 연동할 프로메테우스 뿐만 아니라 Graphite, InfluxDB 등과 같은 다양한 메트릭 수집 시스템과 데이터베이스를 지원하고, 하나의 대시보드에 동시에 여러 메트릭 시스템들의 지표를 표시해주는 강력한 툴입니다.
또한, 설치 및 사용 방법이 쉽기 때문에 많은 회사에서 도입하고 있습니다.
그라파나는 특히 프로메테우스를 잘 지원하기 때문에 프로메테우스와 많이 쓰입니다.
2. 연동하는 방법
2.1 의존성 추가
저는 maven 프로젝트에서 연동을 진행했으므로 pom.xml에 아래의 dependency를 추가했습니다.
gradle 프로젝트의 경우 maven repository에서 위 라이브러리들을 검색해서 gradle 설정을 추가해주시면 될 것 같습니다.
<!-- https://mvnrepository.com/artifact/org.springframework.boot/spring-boot-starter-actuator -->
<dependency>
    <groupId>org.springframework.boot</groupId>
    <artifactId>spring-boot-starter-actuator</artifactId>
    <version>2.7.3</version>
</dependency>
<!-- https://mvnrepository.com/artifact/io.micrometer/micrometer-core -->
<dependency>
    <groupId>io.micrometer</groupId>
    <artifactId>micrometer-core</artifactId>
    <version>1.9.3</version>
</dependency>
<!-- https://mvnrepository.com/artifact/io.micrometer/micrometer-registry-prometheus -->
<dependency>
    <groupId>io.micrometer</groupId>
    <artifactId>micrometer-registry-prometheus</artifactId>
    <version>1.9.3</version>
</dependency>
그리고 application.properties 혹은 application.yml에 아래의 설정을 추가해주시면 됩니다.
server:
  port: [사용할 포트] # 디폴트는 8080

spring:
  application:
    name: [프로젝트명]

  mvc:
    pathmatch:
      matching-strategy: ant_path_matcher

management:
  endpoint:
    metrics:
      enabled: true
    prometheus:
      enabled: true
  endpoints:
    web:
      exposure:
        include: "*"

  metrics:
    tags:
      application: ${spring.application.name}
* spring actuator 의존성을 추가한 뒤 실행했을 때 에러가 발생할 경우 아래 게시글을 참고해주세요.
https://jaimemin.tistory.com/2187
[SpringBoot] Failed to start bean documentationPluginsBootstrapper
개요 SpringBoot에 actuator를 연동한 뒤 실행하였더니 아래와 같은 오류 메시지가 발생했습니다. org.springframework.context.ApplicationContextException: Failed to start bean 'documentationPluginsBootstr..
jaimemin.tistory.com
2.2 Prometheus 설치
프로메테우스를 설치하는 방법은 아래와 같이 여러 가지가 있습니다.
- 서버에 직접 설치
- binary로 설치
- docker를 통해 설치
- kubernetes cluster에 설치
저는 편의를 위해 prom/prometheus 도커 이미지를 pull 받아서 설치해보겠습니다.
A. 우선, 위에 언급한대로 prom/prometheus 도커 이미지를 pull 받습니다.
docker pull prom/prometheus
B. prometheus.yml 파일을 생성하고 원하는 공간에 저장합니다. 저 같은 경우 D 드라이브에 저장했습니다.
global:
  scrape_interval: 5s # 5초마다 매트릭을 수집 default 1분
  evaluation_interval: 1m # 1분마다 규칙을 평가 default 1분

  external_labels: # 외부 시스템에 표시할 이 서버의 레이블
    monitor: [본인이 원하는 서버 레이블]

rule_files: # 규칙을 로딩하고 evaluation_interval 설정에 따라 정기적으로 평가한다.
# - "first.rules"
# - "second.rules"

scrape_configs:
  - job_name: 'monitoring-app' # 잡 이름
    metrics_path: '/actuator/prometheus' # 메트릭을 수집할 path 설정
    static_configs:
      - targets: ['host.docker.internal:8888'] # 도커 인스턴스 내부 호스트:디폴트는 8080
yml 파일을 생성하는 방법을 모르겠으면 https://codebeautify.org/yaml-validator에서 생성하면 됩니다.
YAML Validator Online to validate YAML data
Best and Free YAML Validator is a web based validator and re-formatter for YAML. Also know as YAML Lint.
codebeautify.org
C. B에서 생성한 yml 파일을 기반으로 프로메테우스를 실행해줍니다.
docker run -p 9090:9090 -v {yml 파일이 저장된 상위 경로}/prometheus.yml:/etc/prometheus/prometheus.yml prom/prometheus
* 저는 D 드라이브에 prometheus.yml에 저장했기 때문에 아래와 같이 작성했습니다.
docker run -p 9090:9090 -v D:/prometheus.yml:/etc/prometheus/prometheus.yml prom/prometheus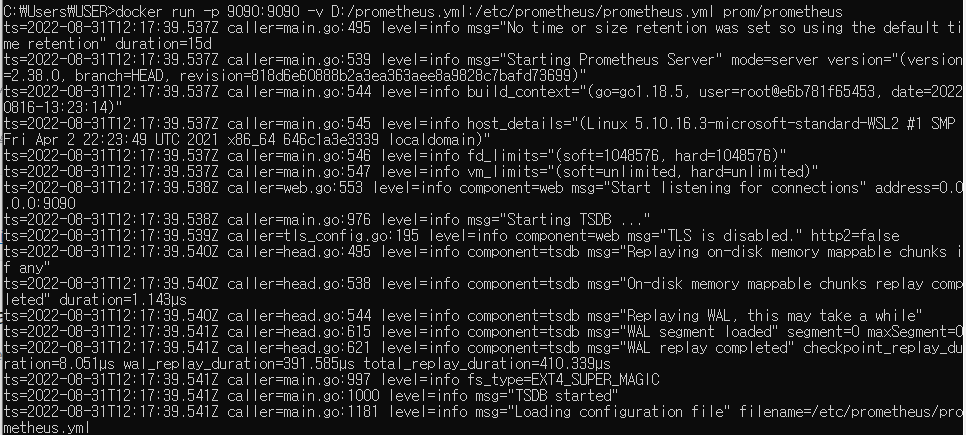
D. localhost:9090에 접속하여 연동이 잘 되었는지 확인합니다.
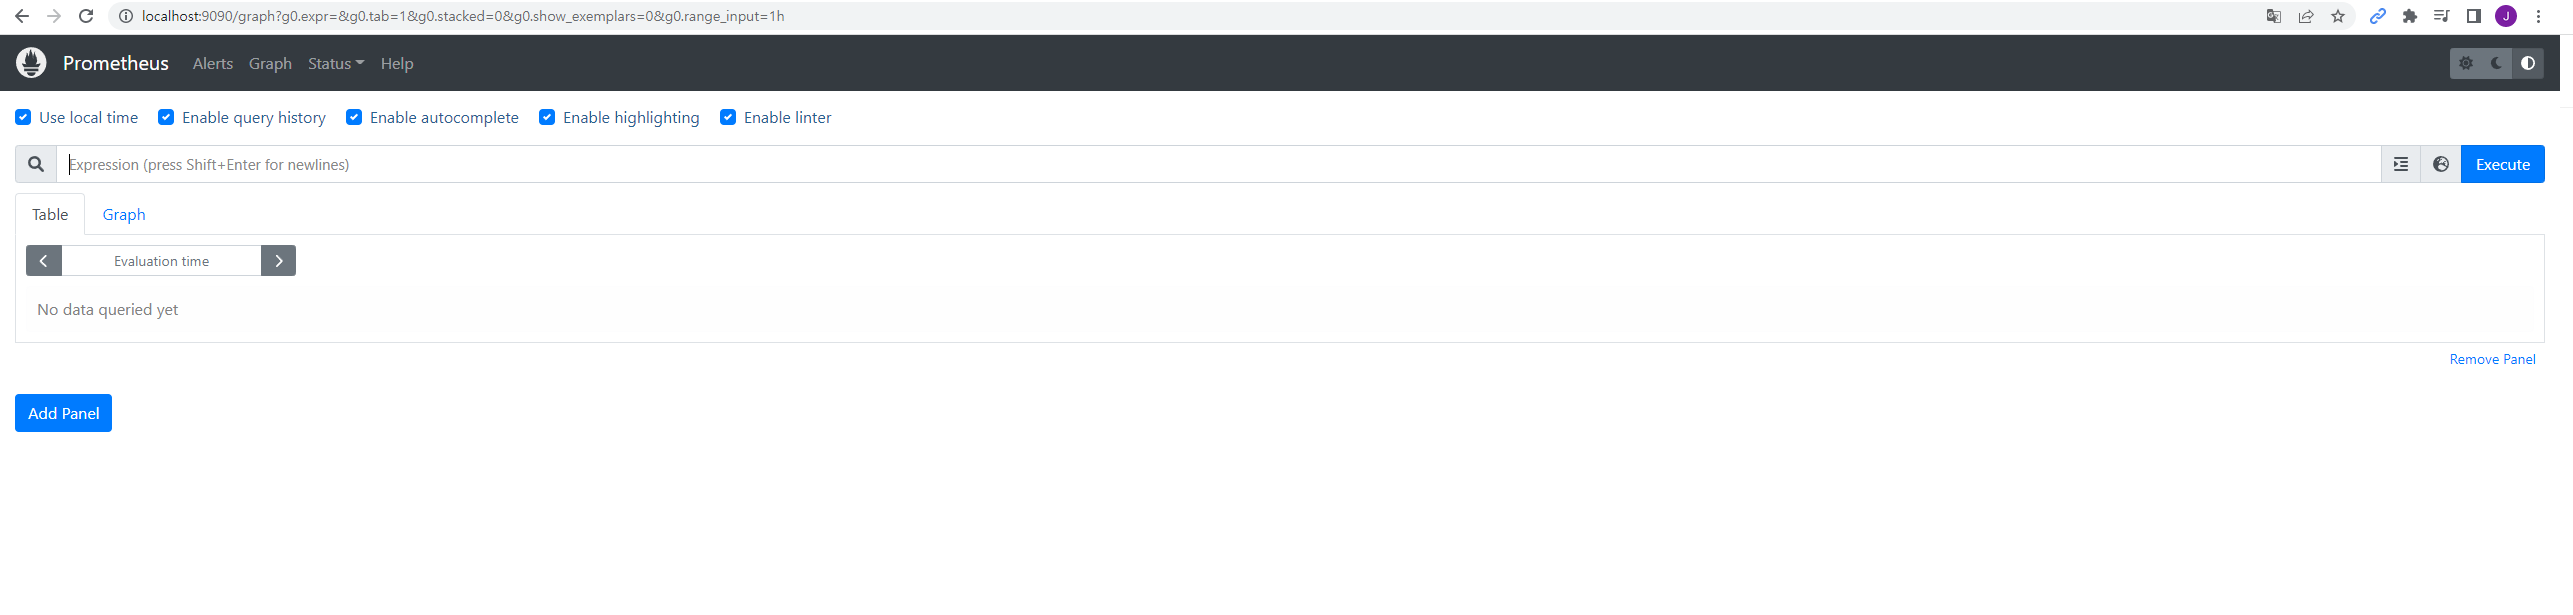
상위 메뉴에 Status > Targets 접속하여 SpringBoot Actuator와 잘 연동이 되었는지 확인합니다.
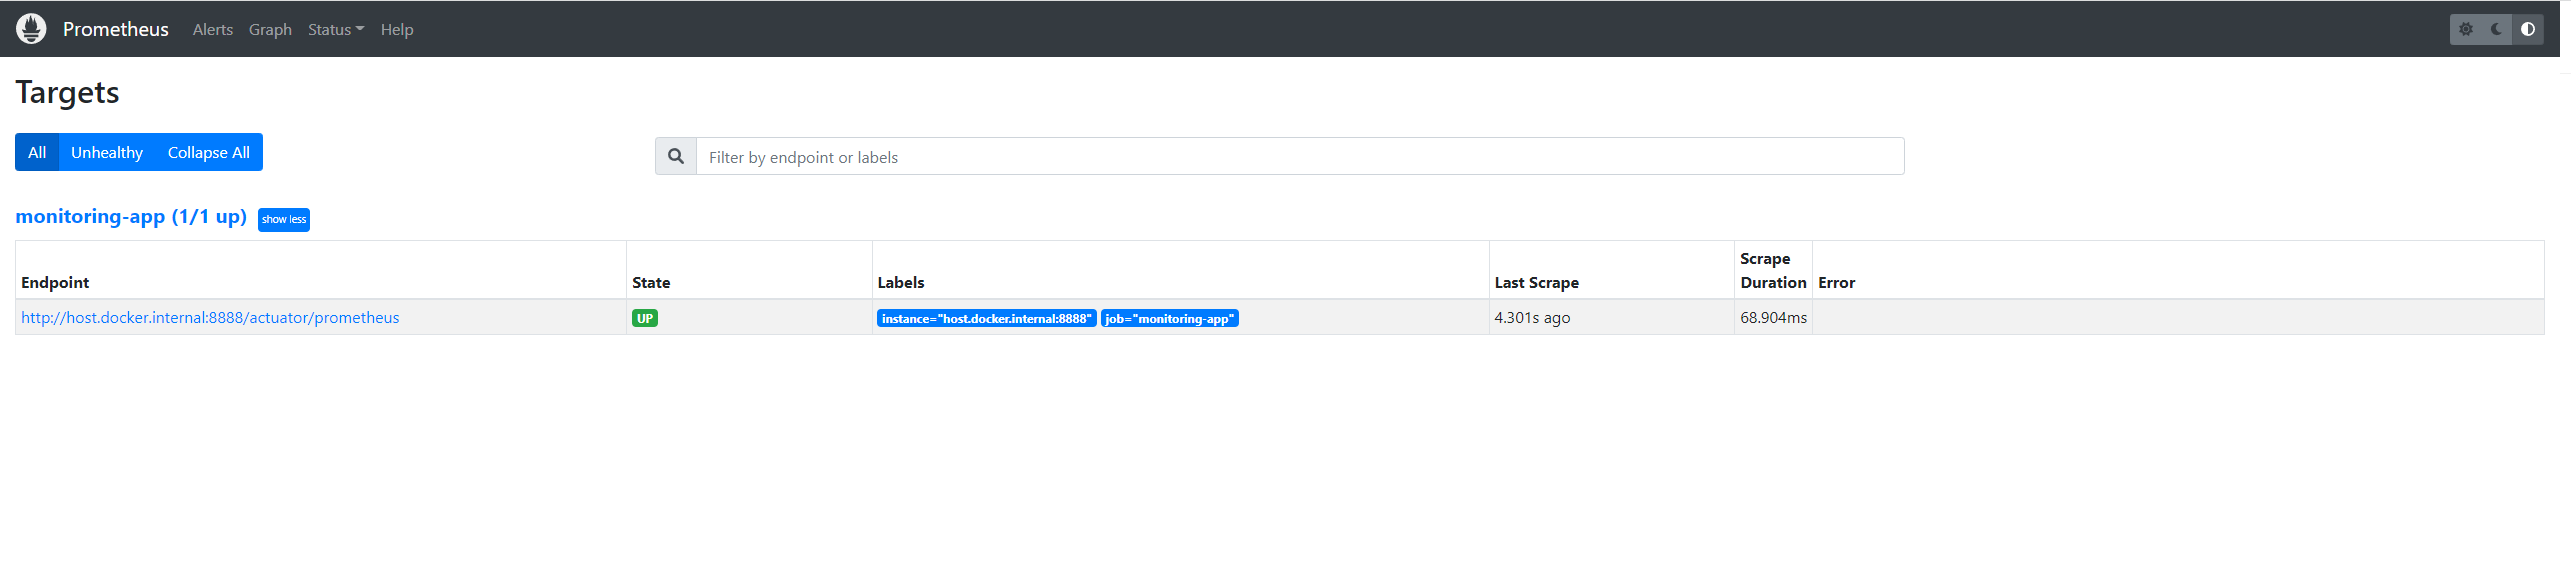
* Status가 DOWN일 경우 아래의 게시글을 참고해주세요.
https://jaimemin.tistory.com/2186
[SpringBoot] Prometheus 연동시 "INVALID" is not a valid start token
개요 Spring Security가 적용된 프로젝트에서 actuator를 적용하고 프로메테우스와 연동했을 때 아래와 같은 오류 메시지와 함께 State가 DOWN인 것을 확인했습니다. "INVALID" is not a valid start token 원인..
jaimemin.tistory.com
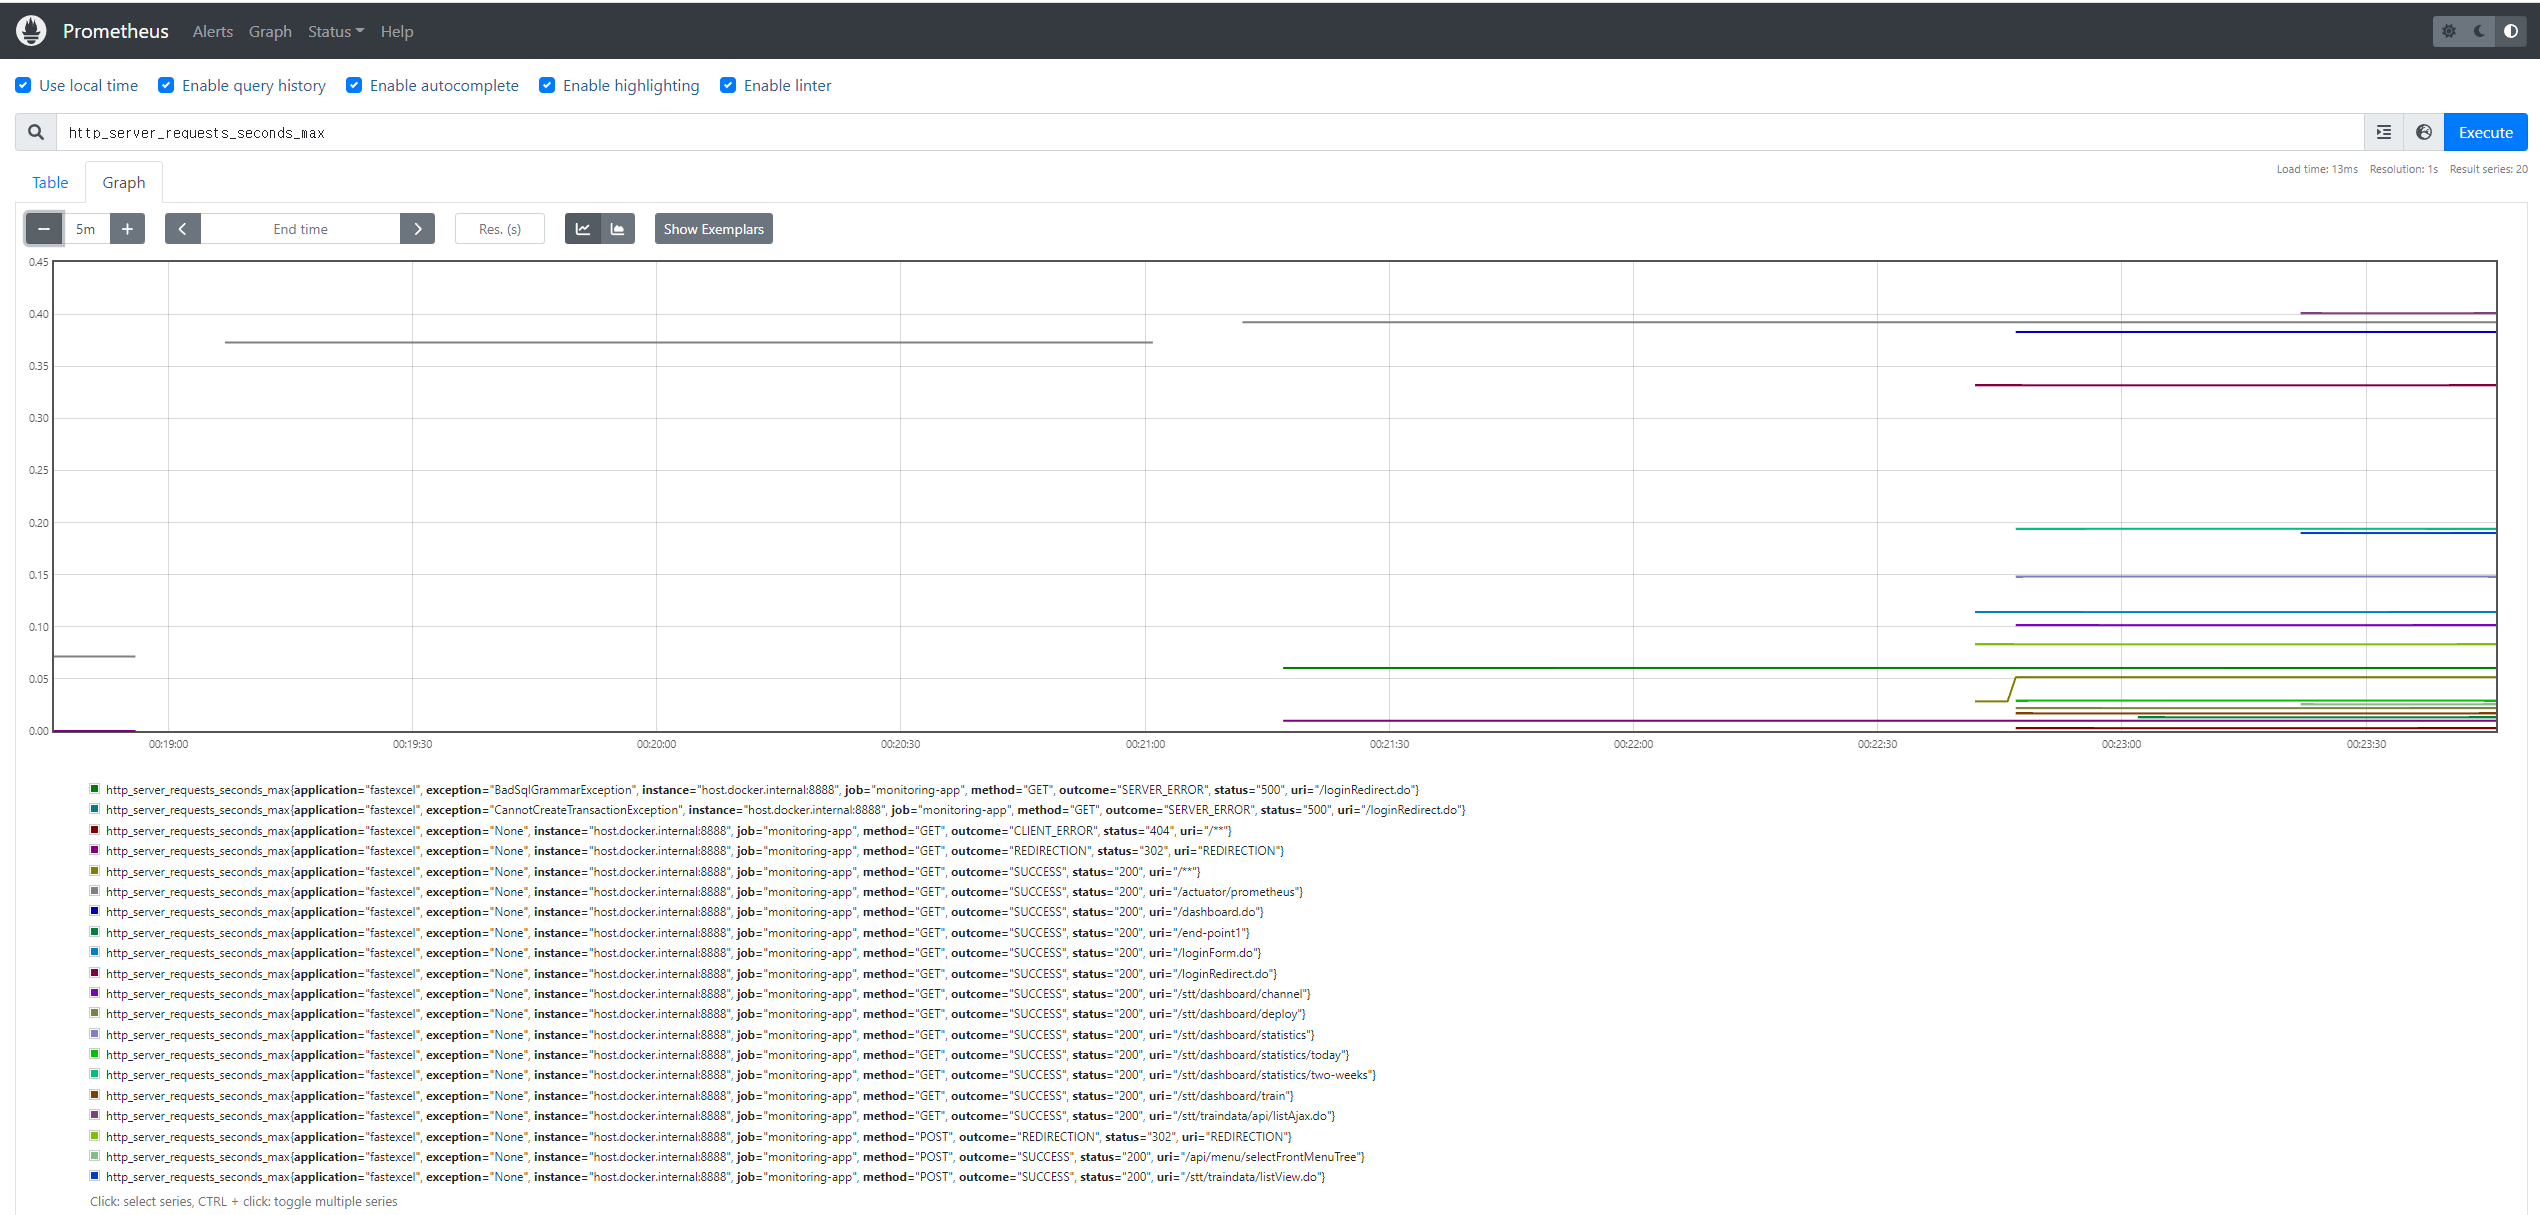
Metric 테스트를 위한 테스트 컨트롤러를 생성하고 호출하여 Prometheus와 잘 연동이 되었는지 확인합니다.
프로메테우스 메인 페이지 메트릭에 http_server_requests_seconds_max를 입력하면 그래프로 시각화하여 볼 수 있습니다.
2.3 Grafana 설치
위 사진을 보시면 알 수 있다시피 프로메테우스도 메트릭에 대한 시각화를 제공하지만 그라파나를 사용할 경우 더욱 강력한 메트릭 시각화를 할 수 있습니다.
그라파나 역시 docker를 통해 설치하겠습니다.
A. grafana/grafana 이미지를 pull 받습니다.
docker pull grafana/grafana
B. 받은 이미지를 통해 grafana를 실행해줍니다.
docker run --name grafana -d -p 3000:3000 grafana/grafana
C. localhost:3000에 접속합니다.
저는 이미 prometheus와 연동하였으므로 연동하는 사진들은 https://devbksheen.tistory.com/183님과 https://covenant.tistory.com/244님 블로그 사진을 가져왔습니다.
문제가 될 경우 삭제하도록 하겠습니다.
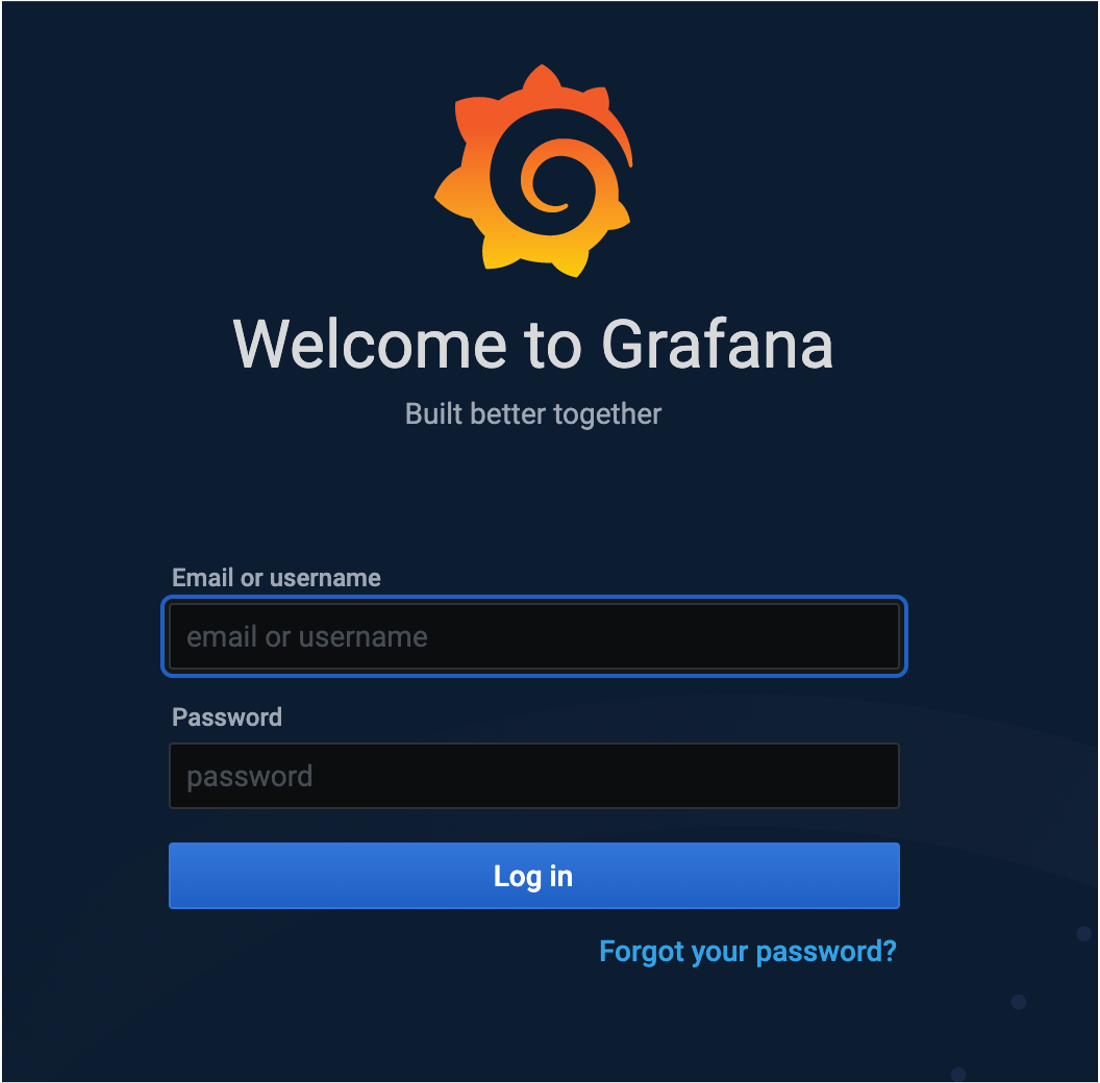
초기 계정은 admin / admin이며 최초 로그인 시 비밀번호를 변경하는 창이 뜹니다.
원하시는 비밀번호를 입력하고 로그인하시면 됩니다.
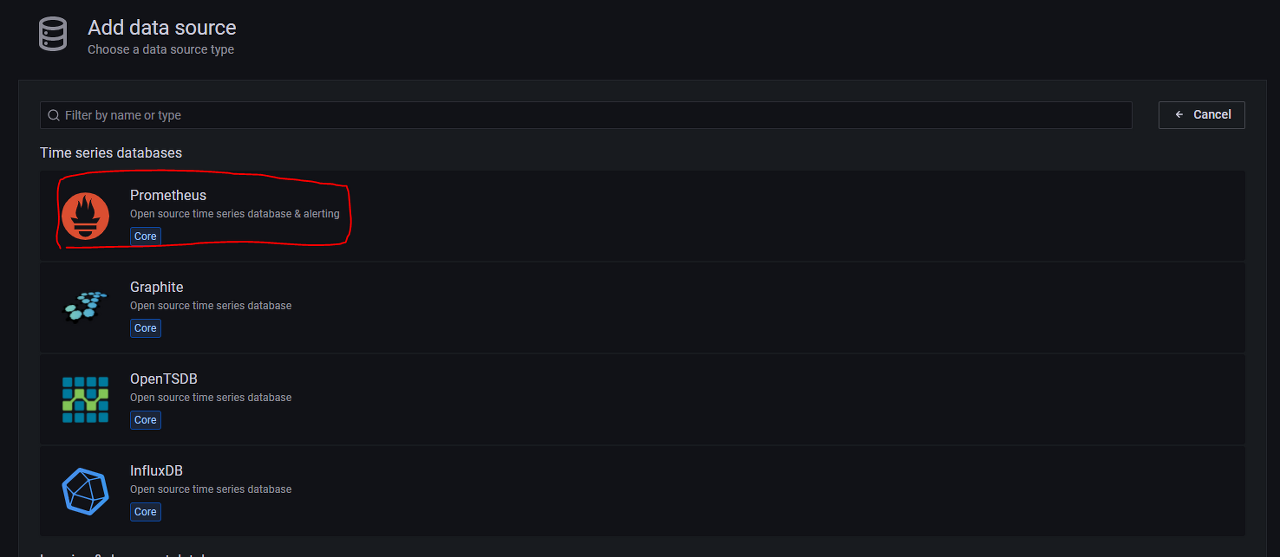
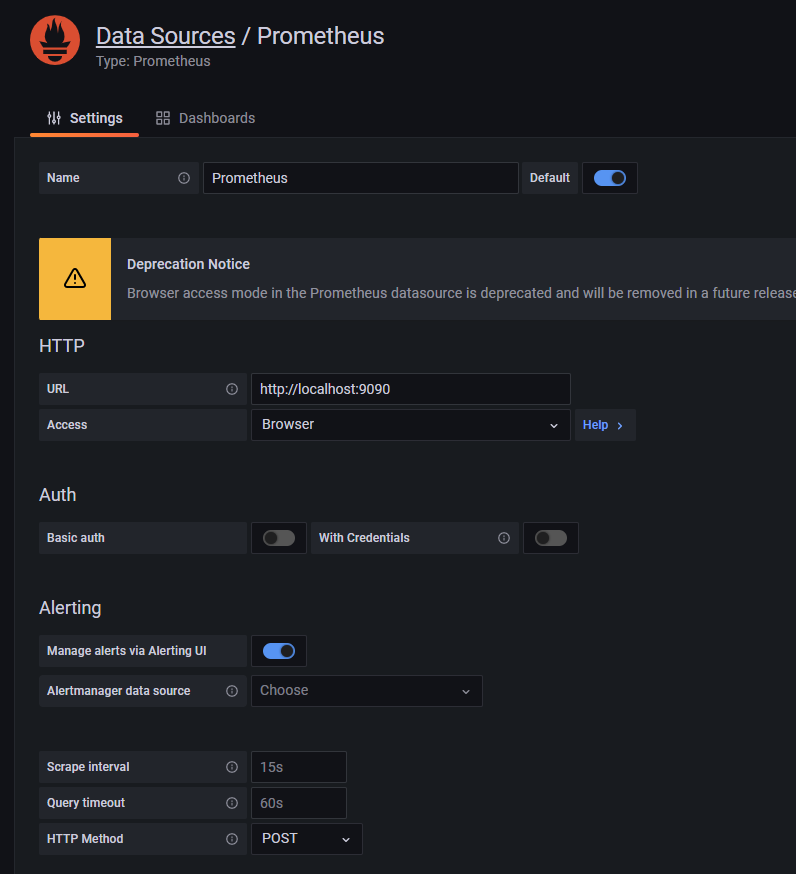
이후, Configuration > Data Source를 추가해 Prometheus와 연동하면 됩니다.
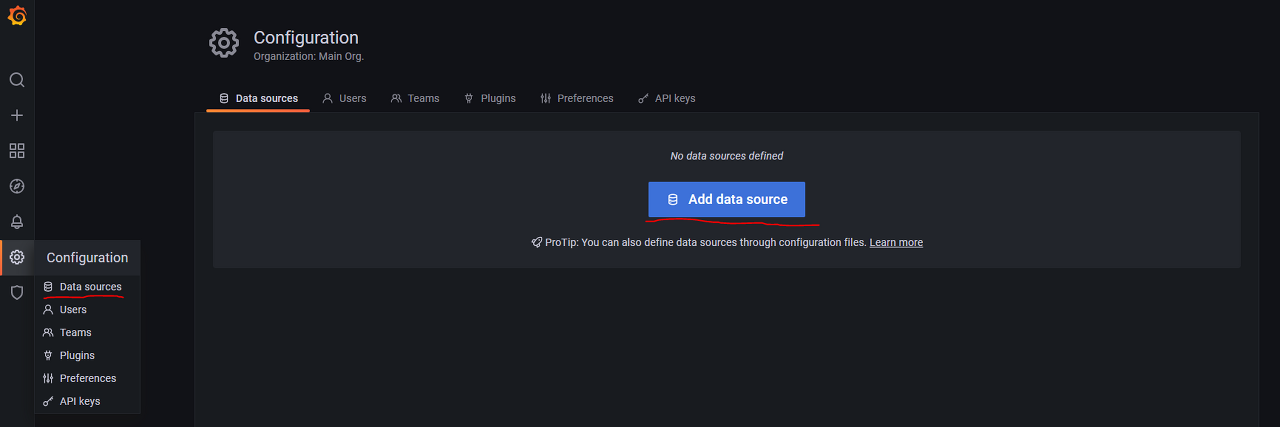
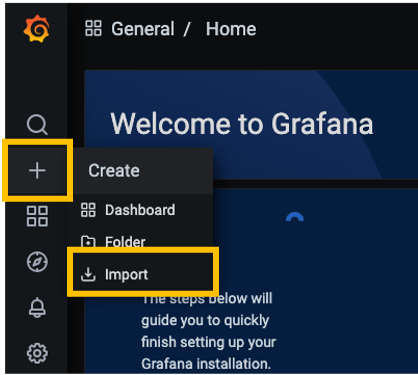
이후 Create > Import를 클릭하여 대시보드를 생성해줍니다.
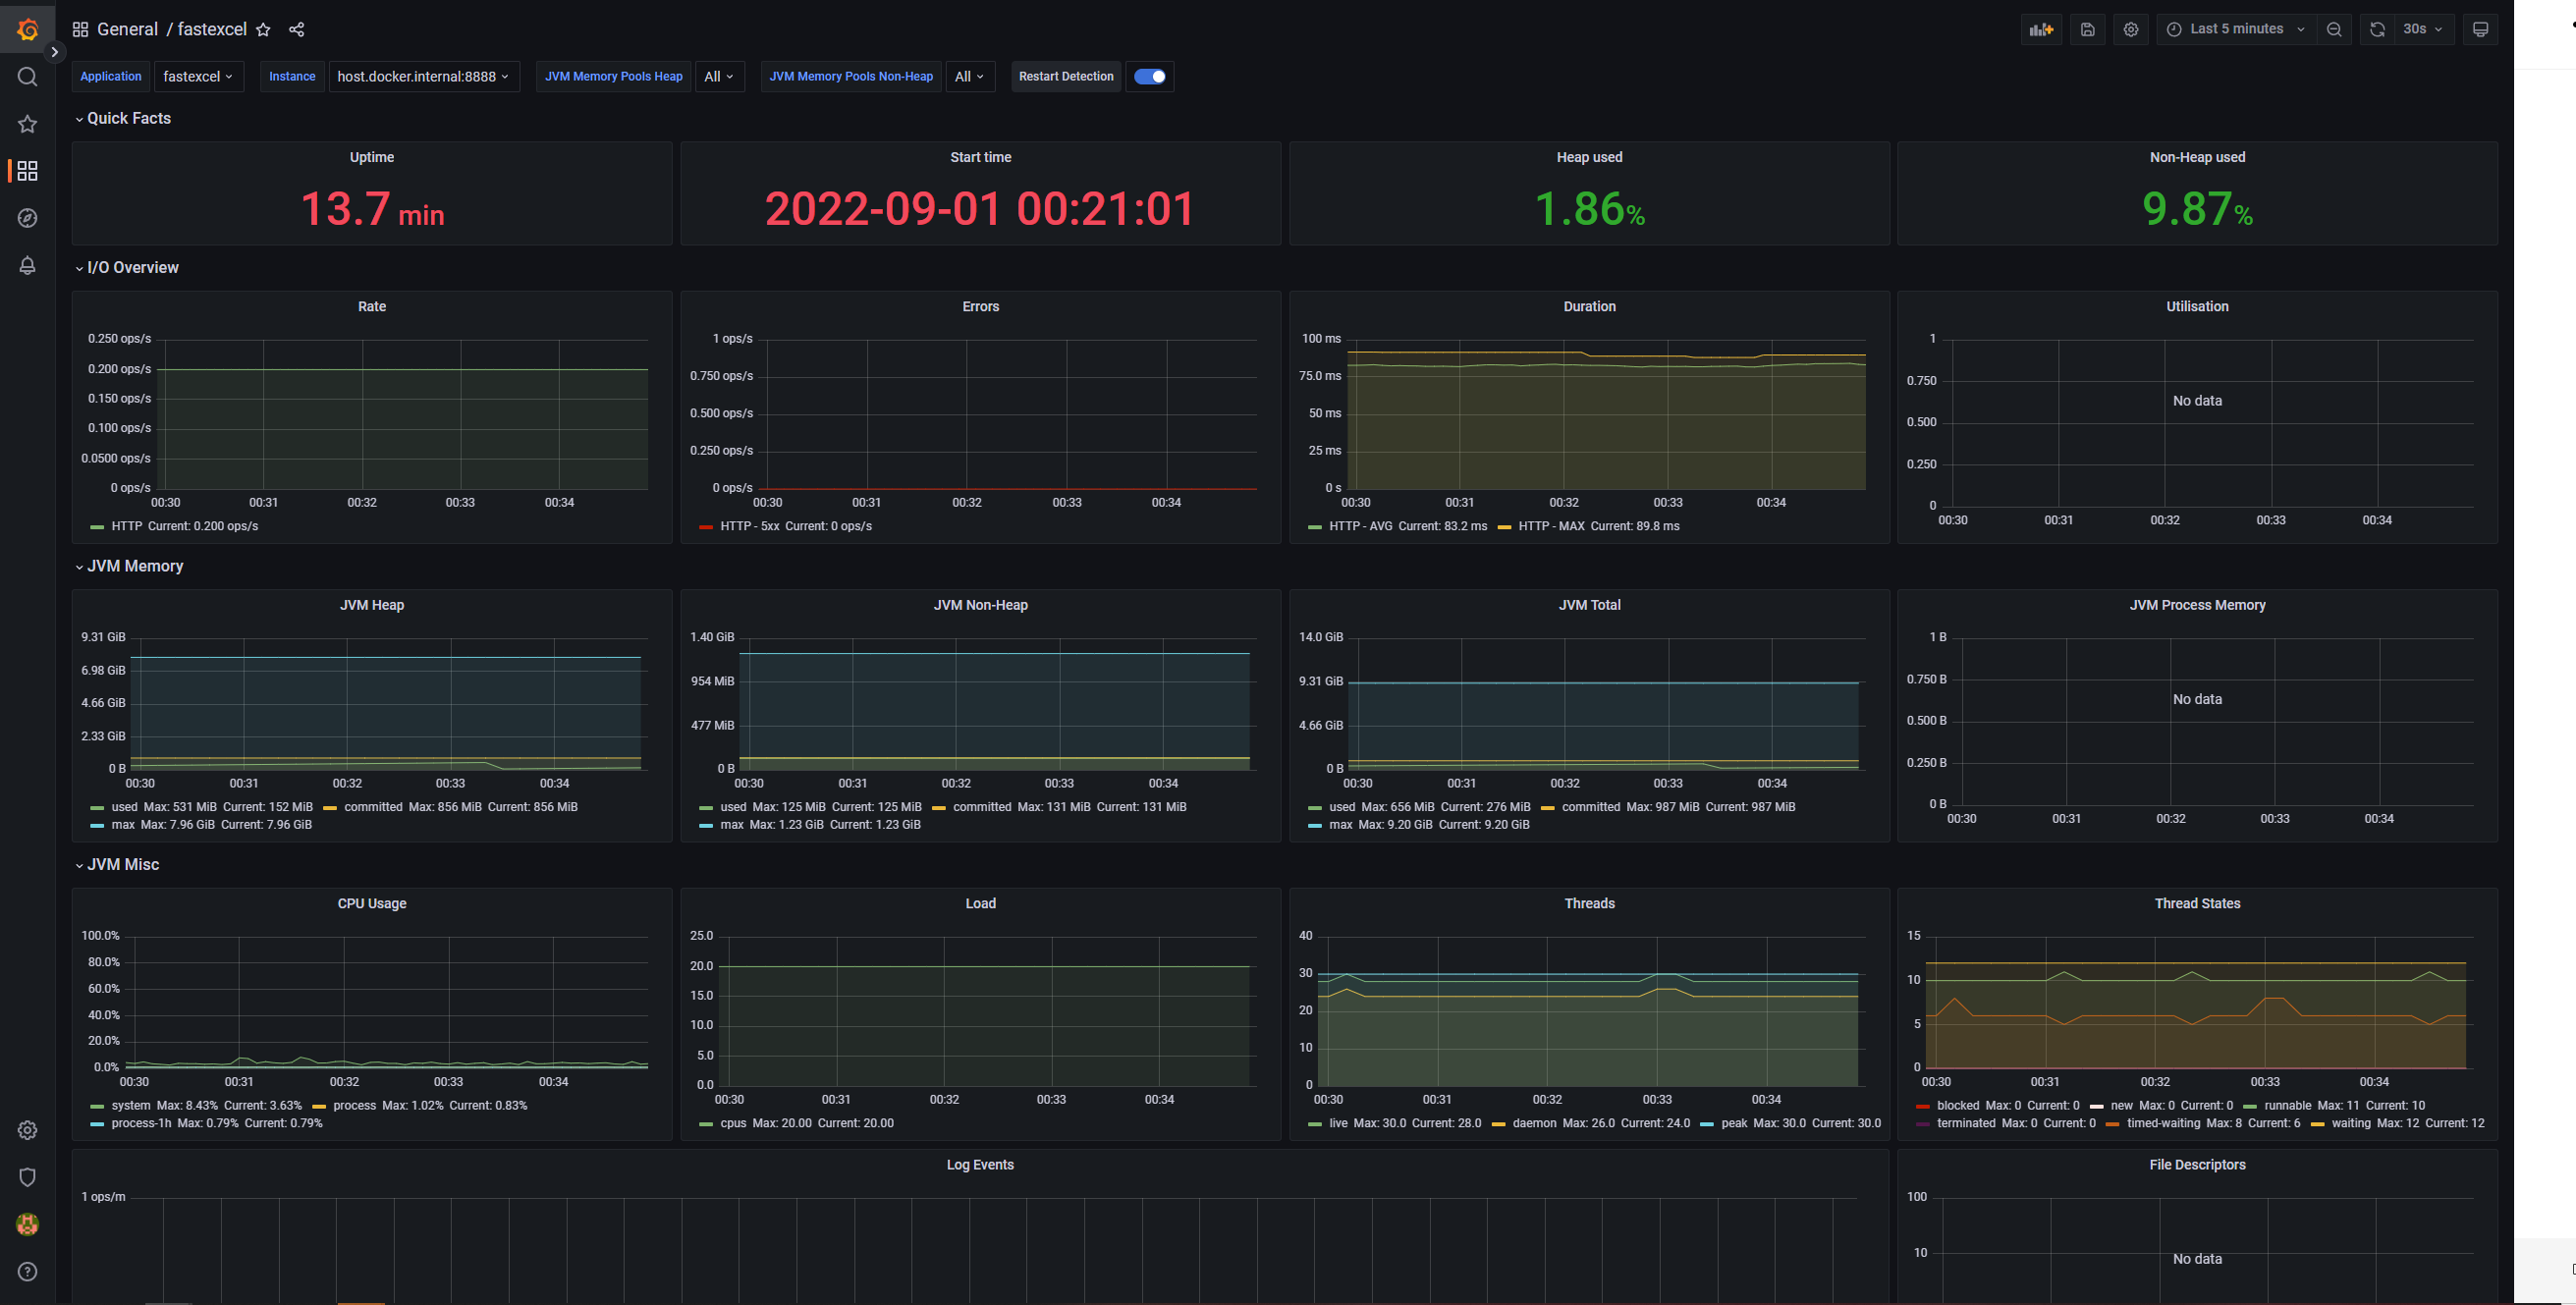
SpringBoot 메트릭을 보여주는 유명한 대시보드로 JVM dashboard가 있으며 이를 import 해주도록 하겠습니다.
https://grafana.com/grafana/dashboards/4701-jvm-micrometer/
JVM (Micrometer)
Edit Delete Confirm Cancel
grafana.com
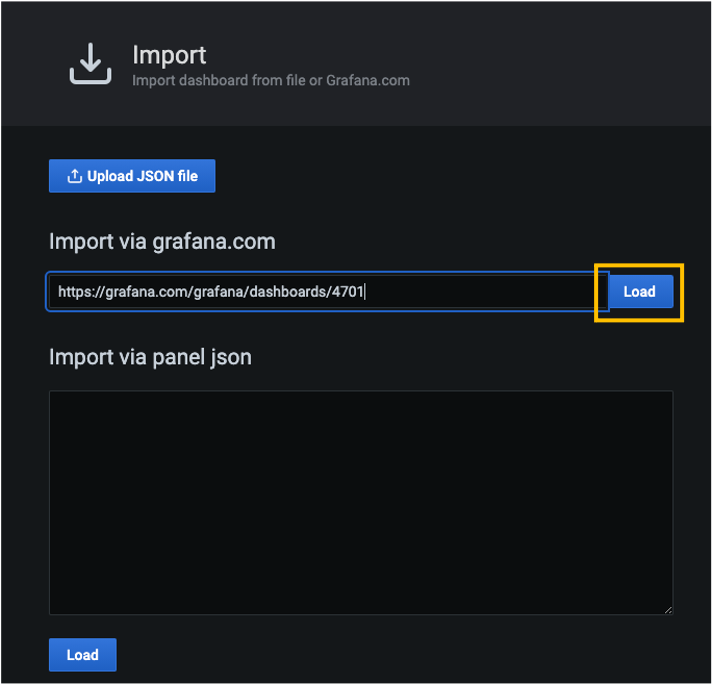
Import를 누르고 https://grafana.com/grafana/dashboards/4701를 입력한 뒤 Load 버튼을 클릭해주면 dashboard 생성이 완료됩니다.
대시보드를 생성하면 아래와 같이 다양한 metric 정보를 확인할 수 있습니다.
비고
JVM 대시보드 외 다른 대시보드를 import 받기를 원하면 아래 사이트를 참고하시면 될 것 같습니다.
https://grafana.com/grafana/dashboards/
Dashboards
grafana.com
출처 및 참고
https://devbksheen.tistory.com/183
Spring Boot + Prometheus + Grafana를 이용한 모니터링(3/3)
이 전 블로그 글에서 Spring Boot 프로젝트를 생성하고 Prometheus와 연동까지 해봤다. 이제 Grafana를 연동해 시각화를 해보자. Grafana 설치 및 사용 Grafana 역시 도커로 설치하겠다. docker run -d -p 3000:30..
devbksheen.tistory.com
https://covenant.tistory.com/244
프로메테우스, 그라파나를 이용한 스프링부트 모니터링
Cover Photo by Tobias Tullius on Unsplash 0. 소개 스프링부트 웹 애플리케이션을 배포하여 경우 잘 동작하는지 모니터링을 통하여 애플리케이션의 상태를 확인해야합니다. 모니터링을 통하여 문제가 발
covenant.tistory.com
https://www.inflearn.com/questions/342442
metric이 정확히 어떤 의미인가요? - 인프런 | 질문 & 답변
- 학습 관련 질문을 남겨주세요. 상세히 작성하면 더 좋아요! - 먼저 유사한 질문이 있었는지 검색해보세요. - 서로 예의를 지키며 존중하는 문화를 만들어가요. - 잠깐! 인프런 서비스 운영 관련
www.inflearn.com
'[DEV] 기록' 카테고리의 다른 글
| [SpringBoot 2.X.X] No beans of 'AuthenticationManager' type found. (0) | 2022.10.20 |
|---|---|
| [Java] 엑셀 데이터 읽어오는 코드 (1) | 2022.10.15 |
| [SpringBoot] Failed to start bean documentationPluginsBootstrapper (0) | 2022.08.31 |
| [SpringBoot] Prometheus 연동시 "INVALID" is not a valid start token (0) | 2022.08.31 |
| [Docker] 윈도우 10 도커 설치 WSL 2 installation is incomplete 발생하는 경우 (0) | 2022.08.28 |